Ask a question before opening a dashboard
Start with “Which source brought suitable inquiries?” rather than “How is my marketing doing?” Use a complete period, such as the last 28 days, and compare with a prior period of the same length. Keep weekdays, timezone, geography, and major promotions in mind. Exclude your own QA activity where appropriate. The newest data may still be processing, so do not diagnose the business from this morning’s incomplete total.
Know what a row and a column mean
A dimension is a label, such as source, device, or landing page. A metric is a number, such as sessions, revenue, or event count. One person can have several sessions and view several pages. An event records an interaction; a key event is an event marked as important. A count of ten form events is not necessarily ten people or ten qualified leads.
In GA4, use Traffic acquisition to examine sessions and User acquisition to examine how users were first acquired. These reports answer different questions. Look at the column label: Session source / medium and First user source / medium are different scopes. Do not compare their rows as if they used the same grouping.
Walk through a traffic acquisition report
- Open Reports and find Traffic acquisition. Navigation varies with your property’s report collection; use report search if it is not in the Acquisition menu.
- Set your dates. Select Session source / medium, or Session campaign for tagged campaigns. Add a device or landing-page breakdown when relevant.
- Read sessions first, then an event you intentionally configured for the business action. Select the specific inquiry event when available instead of blending every key event.
- Check the corresponding lead records for duplicates and qualification. Write one sentence about the difference.
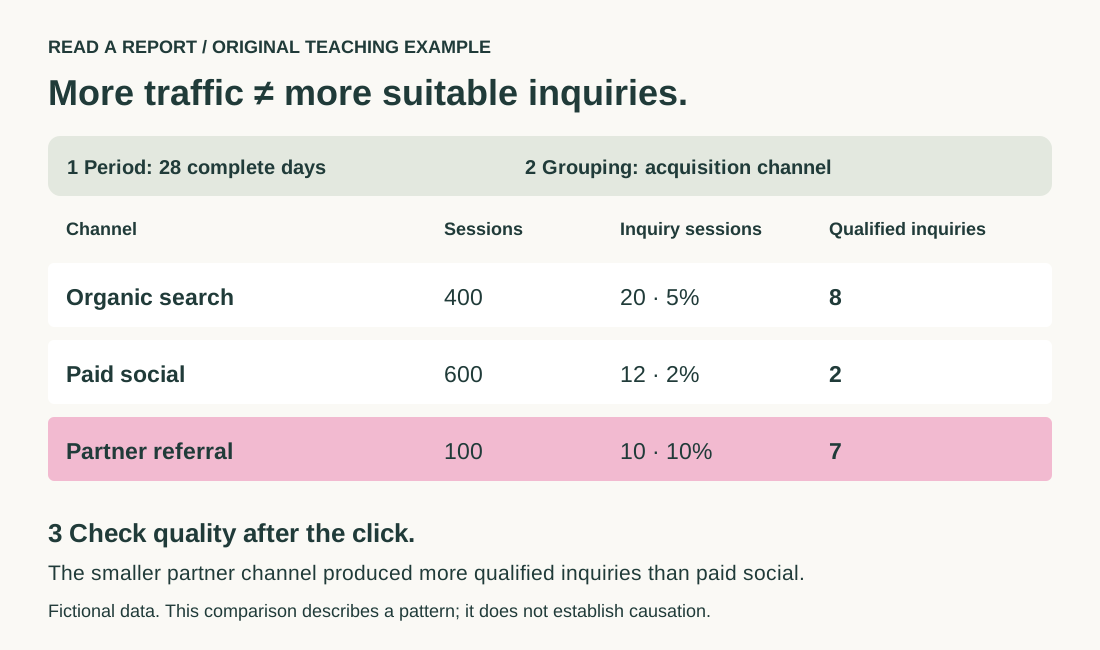
| Channel — fictional 28 days | Sessions | Sessions with inquiry | Inquiry session rate | Qualified inquiries |
|---|---|---|---|---|
| Organic search | 400 | 20 | 5% | 8 |
| Paid social | 600 | 12 | 2% | 2 |
| Partner referral | 100 | 10 | 10% | 7 |
| Total | 1,100 | 42 | 3.82% | 17 |
The paid source produced six times as many sessions as the partner, but fewer qualified inquiries. That does not establish that partners always win. It gives you a concrete question: did the partner attract a better-fit audience, or did those visitors reach a clearer offer?
Use Search Console to understand search visibility
Open the Search results Performance report. Read impressions as search appearances, clicks as search-result clicks, CTR as clicks divided by impressions, and position as an average rather than a fixed rank. Filter a query and inspect its pages; then compare devices or countries. A rise in impressions with falling CTR could reflect broader, lower-intent exposure, a different query mix, or changed search presentation.
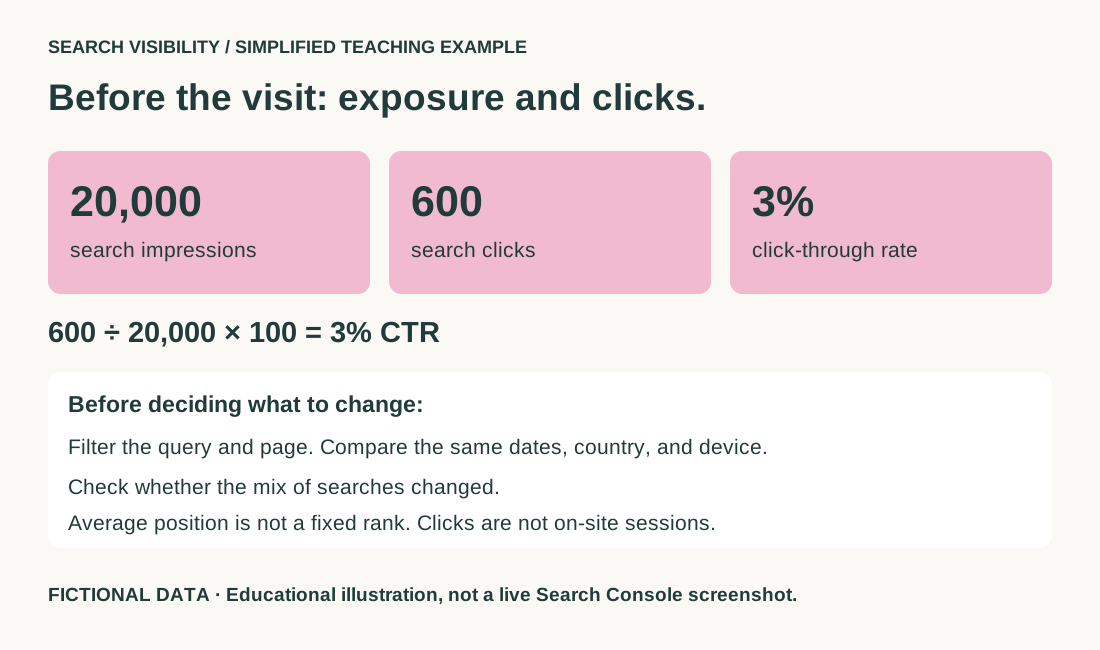
Search Console covers search activity; GA4 covers observable on-site activity. Their totals need not match. Do not “correct” one system by overwriting its numbers with the other.
Understand engagement and disagreement
GA4 engagement rate is the share of sessions counted as engaged; bounce rate is its complement. Under the default engagement definition, a session can qualify through duration, multiple views, or a key event. A short visit can still solve a question. Avoid treating time alone as customer satisfaction.
If ad clicks exceed sessions, check destination-click versus all-click reporting, slow loads, consent, blockers, redirects, date boundaries, and accidental duplicate tags. If sales differ, check attribution windows, timezones, refunds, cross-device activity, and order-event implementation. Missing data is a limitation to document, not a reason to invent a reconciled total.
Finish with a useful weekly note
Write four lines: what changed; which segment changed; the most plausible explanations; and what you will check next. For the fictional report: “Partner visits produced 7 qualified inquiries from 100 sessions. I will review those seven conversations and invite one similar partner to a small collaboration.” Avoid declaring causation from this descriptive comparison.
Your first assignment: export one report, circle its date range, underline its dimension, and identify the numerator and denominator of one rate. If you cannot explain those four things, keep investigating before changing your budget.
Sources and further reading
Primary references checked October 11, 2026. Exercises, frameworks, and fictional examples are our teaching material; forecasts are labelled as scenarios.
Keep exploring
Campaign Studio explained: every field, every number, and your first campaign
Marketing KPIs explained: traffic, PPC, conversion, and customer growth