Jump to a useful section
A reference you can use while doing the work
We went through the pain of this so you don’t have to. Here is the plain-English version, with a practical example for every term.
A marketing report can contain accurate numbers and still encourage the wrong decision. Cheap clicks can produce expensive customers. High attributed revenue can leave little contribution. Learn the definitions, connect the stages, and use one consistent measurement contract before comparing campaigns.
About the numbers: these are hypothetical teaching examples, not business results or recommended targets. Dollar amounts use USD for illustration.
1. Understand attention and traffic
Impressions
The number of recorded times content or an ad is shown. One person may produce multiple impressions.
Example: An ad displayed 20,000 times has 20,000 impressions; it does not necessarily reach 20,000 people.
Reach and frequency
Reach estimates distinct people or accounts exposed; frequency is average impressions per reached person on a consistent basis.
Example: 20,000 impressions ÷ 5,000 reached people = four average exposures. Individual exposure varies.
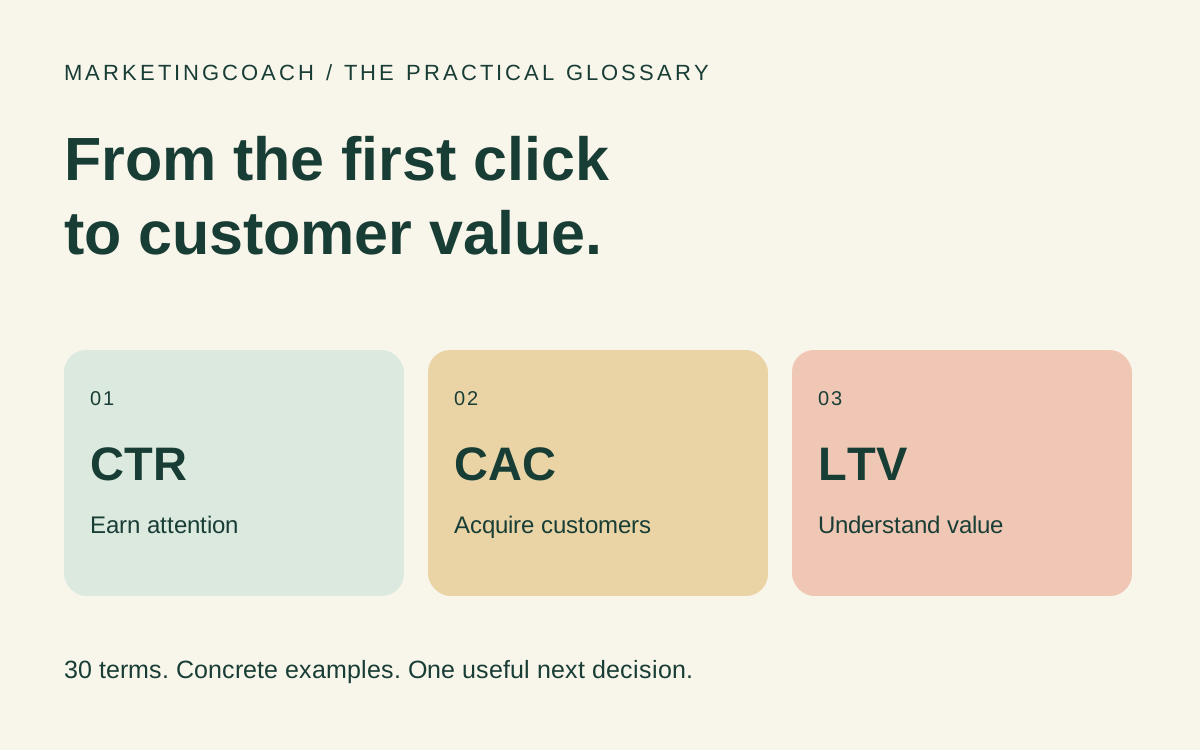
CTR — click-through rate
Clicks divided by impressions for the same ad, placement and period. State which click definition the platform uses.
Example: 400 link clicks ÷ 20,000 impressions = 2% link CTR.
CPC — cost per click
Ad cost divided by counted clicks. A lower CPC does not establish better customer economics.
Example: $800 ad spend ÷ 400 clicks = $2 CPC.
CPM — cost per thousand impressions
Ad cost divided by impressions, multiplied by 1,000.
Example: $800 ÷ 20,000 impressions × 1,000 = $40 CPM.
Session
A group of interactions defined by an analytics system’s session rules. A session is not necessarily a person or an ad click.
Example: One person visits Monday and returns Wednesday: that may be two sessions but one recognized user.
SEO and search intent
SEO improves discoverability in organic search; intent is what the searcher is trying to accomplish.
Example: A definition article serves “what is payroll”; a service comparison better fits “payroll provider for a 20-person company.”
UTM parameters
Campaign labels added to URLs to help analytics identify traffic. Naming consistency matters.
Example: Use utm_source=newsletter, utm_medium=email and one agreed campaign name. Avoid personal information in URL labels.
2. Connect visits to customers
CTA — call to action
The specific next action you invite a person to take. It should fit their stage and the destination.
Example: “See the package and price” gives an uncertain buyer a clearer next step than a vague “Learn more.”
Landing page
The page a person enters on, often designed around a campaign’s promise and next action.
Example: An ad for a bookkeeping consultation opens the consultation page, not an unrelated general homepage.
Conversion rate
A defined completed action divided by a defined eligible group. State whether the denominator is clicks, sessions, users or leads.
Example: 40 leads ÷ 400 ad clicks = 10% click-to-lead conversion in this simplified matched cohort.
CPL — cost per lead
Selected campaign cost divided by leads. Include the cost scope in the label.
Example: $800 ads ÷ 40 leads = $20 ad-only CPL. Sales follow-up is not included.
Qualified lead
A lead that meets written fit criteria. The definition should agree with the sales team’s use.
Example: Twenty of the 40 leads have the right need, service area and budget: 50% qualify.
CPA — cost per action
Cost divided by a specified action. CPA can mean a lead, purchase or other event; name it.
Example: $800 ads ÷ eight purchases = $100 ad-only purchase CPA. A $20 lead CPA would refer to a different action.
CAC — customer acquisition cost
Included acquisition-related sales and marketing costs divided by new customers. Customer identity and sales-cycle timing matter.
Example: $800 ads + $200 acquisition labor and tools, divided by eight new customers, gives $125 CAC.
CRO — conversion rate optimization
Improving a defined customer journey using evidence and experiments. More conversions only help if quality and economics remain acceptable.
Example: Clarify delivery timing on a service page, then track qualified enquiries as well as total form submissions.
3. Translate campaign numbers into economics
AOV — average order value
Revenue under your chosen sales definition divided by orders. Use a consistent treatment of discounts, returns, tax and shipping.
Example: $4,000 net order revenue ÷ eight orders = $500 AOV.
ROAS — return on ad spend
Attributed revenue or conversion value divided by ad cost. It is neither profit nor a causal estimate.
Example: $4,000 attributed revenue ÷ $800 ads = 5× revenue ROAS.
Contribution margin
Revenue less variable costs, expressed in dollars or as a share of revenue. State whether advertising is included.
Example: $4,000 revenue − $2,800 variable delivery costs = $1,200, or 30%, before advertising and overhead.
Break-even ROAS
The revenue ROAS needed to cover ad spend at a given pre-ad contribution margin, assuming the attributed sales are additional.
Example: At 30% pre-ad contribution, 1 ÷ 0.30 = about 3.33× ROAS to cover ads only. Fixed costs and desired profit require more.
MER — marketing efficiency ratio
A blended revenue-to-spend ratio. Usage varies; always name whether the denominator is media spend or all marketing costs.
Example: $10,000 total revenue ÷ $2,000 total marketing cost = 5× MER on this definition. It does not identify the causal effect of a channel.
LTV — customer lifetime value
Expected revenue or contribution over a customer relationship. State the horizon and separate observed cohort results from projections.
Example: Three expected $100 orders give $300 revenue LTV; at 40% contribution, modeled contribution LTV is $120 before acquisition.
LTV:CAC and payback
The ratio compares customer value with acquisition cost; payback measures when cumulative contribution covers acquisition.
Example: $120 contribution LTV ÷ $40 CAC = 3×. At $20 contribution per order, payback requires two orders.
ROI — return on investment
Net benefit after the included investment costs, divided by those costs. State the attribution or incremental basis.
Example: A test produces $1,500 contribution before its $1,000 campaign cost: ($1,500 − $1,000) ÷ $1,000 = 50% ROI if the benefit is truly additional.
4. Know what the measurement proves
Attribution
A rule or model assigning conversion credit to touchpoints within a time window. Credit is not causation.
Example: An ad platform and an email platform each claim the same $500 purchase. Your order system still records one $500 purchase.
Incrementality
The extra outcome caused by an intervention compared with what would otherwise have happened. It needs a credible comparison.
Example: A well-run randomized holdout can compare eligible customers who receive a campaign with those who do not; before/after alone is weaker evidence.
A/B test
An experiment assigning eligible units to alternatives, ideally randomly, and comparing predefined outcomes.
Example: Assign visitors consistently to two page versions. Choose the primary conversion and sample plan before examining the result.
Percentage points versus relative lift
Percentage-point change subtracts rates; relative lift divides that change by the baseline.
Example: Conversion rises from 2% to 3%: +1 percentage point and +50% relative lift, not +1% relative lift.
Retention and cohort
Retention tracks continued customer behavior; a cohort groups customers by the same starting event or trait.
Example: Thirty of 50 January buyers repurchase within 90 days: 60% under that repeat-buying definition. Compare February only after 90 days too.
CRM and lifecycle automation
A CRM manages customer records; lifecycle automation sends or performs relevant actions based on customer state.
Example: A prospect who purchases exits the sales reminder sequence and enters the appropriate onboarding path.
See the concepts work together
Worked example · common scale
Follow one simplified campaign cohort
Worked example · calculation steps
A 5× ROAS campaign can leave just $200
Worked example · calculation steps
The same change, two correct descriptions
Use an app marketplace to fill one real gap
An app marketplace is a directory of extensions for a particular platform. It can help you add a missing capability to your current site or workflow. Start with the customer’s stuck step and the metric you expect to change, then search for the capability.
| Need | What to investigate |
|---|---|
| Your ad report cannot show which leads became customers | Search for CRM sync, offline conversion support and deduplication for the exact platforms you use. Verify consent requirements, field mappings and failed-sync handling. |
| Where to look | Explore the HubSpot Marketplace for CRM connections, Zapier’s app directory for workflow connections, or your existing platform’s official marketplace. |
- Name the job. Write one sentence: “When this event happens, this person needs this useful next step.” Check whether your current plan already supports it.
- Compare two or three candidates. Check the required plan, current fees and usage limits, recent maintenance, support, permissions, supported data fields and cancellation terms.
- Calculate the full cost. Include setup and maintenance. A $60 monthly app needs three genuinely additional sales at $20 contribution per sale to cover its fee. With $120 setup, the first month needs nine such sales. Sales merely credited to the app are not necessarily additional.
- Test a complete journey. Use a safe test account or draft environment. Check success, failure, cancellation and duplicate events; verify mobile behavior and what happens after uninstalling.
- Keep or remove it on evidence. Record a baseline, an owner and a review date. Measure contribution, reliability or usable time saved. Hours freed are capacity until you actually turn them into value.
Directory links are ordinary official links. Availability, compatibility and pricing can change; verify the listing before installing. An app recommendation should explain fit and trade-offs rather than treating every popular extension as essential.
Give an AI agent a useful, reviewable job
Ask an agent to reconcile definitions, check arithmetic, research app capabilities, classify anonymized feedback or draft a weekly review. Provide the source records and your cost definitions. Keep purchases, live installations, customer messages and budget changes subject to the permissions you explicitly grant.
Review this campaign dataset using the supplied metric definitions. Recalculate CTR, CPC, lead conversion, qualified-lead cost, CAC and contribution after acquisition. Keep platform-attributed revenue separate from deduplicated orders. Flag missing cost categories and inconsistent windows. Suggest one test; do not change campaigns or spending.
Check the result against the original records. A polished explanation is not proof that the data is complete or that the proposed change will work.
Put five terms to work this week
- Choose one decision. What are you trying to improve or learn?
- Select five measures at most. Define the event, denominator, time window, costs and source for each.
- Calculate one real example. Reconcile it with an order, customer, invoice or observed task.
- Make one bounded change. Record the hypothesis, owner, cost limit and review date.
- Review the evidence. Continue, revise or stop. Record uncertainty and customer feedback alongside the numbers.
Use the free Marketing Reset to choose one bottleneck and a seven-day experiment. For guided practice, explore the Marketing Practice Lab. If the measurement or campaign needs review, see the scope of Marketing Coaching.
Definitions and further reading
Numerical examples, graphics and exercises in this guide are original hypothetical teaching scenarios. They are not client results, industry benchmarks or forecasts. Different examples are independent unless explicitly connected. For platform-specific reporting definitions, consult Google Ads on CTR and Shopify on customer lifetime value. Report your own cost scope and observed cohort horizon alongside any simplified LTV model. Official marketplace directories were checked November 2, 2026.
Keep exploring
How to Learn PPC and Keyword Research: An Eight-Week Practice Plan
Forward Deployed Design for Marketing Teams: From Brand Rules to Better Experiments